
Is the fall in pupil numbers within “historical patterns” as the Government now claims?
Education Not Taxation’s report on VAT on private school fees; ‘What Was Promised. What Happened’ found that the policy had already exceeded the Government’s own published forecasts.
Rather than explaining why or accepting the policy has flaws, Ministers have now turned to a new defence to explain the fall in pupil numbers at independent schools;
| GOVERNMENT RESPONSE“…pupil numbers remain firmly within historical patterns seen for over the last 20 years.”Department for Education, Written Parliamentary Answer, June 2026 |
We looked at the historical data to test that statement.
Here’s the historical data from the Department for Education census
Census data is recorded each January and reported the following June. DfE only publishes a mainstream/special split from 2015/16 onward — every year is shown, marked “—” where no split exists.
(Independent special-school numbers are rising for reasons unconnected to VAT — most places are local-authority-funded and in effect exempt from the tax.) Note: This data is for England only, the DofE Census does not cover Scotland, NI and Wales.
| Year | Total pupils | YoY % | Mainstream | Mainstream YoY | Special |
| 2006 | 580,510 | — | — | — | — |
| 2007 | 577,665 | −0.49% | — | — | — |
| 2008 | 582,330 | +0.81% | — | — | — |
| 2009 | 582,400 | +0.01% | — | — | — |
| 2010 | 576,845 | −0.95% | — | — | — |
| 2011 | 576,230 | −0.11% | — | — | — |
| 2012 | 577,445 | +0.21% | — | — | — |
| 2013 | 579,680 | +0.39% | — | — | — |
| 2014 | 578,975 | −0.12% | — | — | — |
| 2015 | 582,865 | +0.67% | — | — | — |
| 2016 | 583,029 | +0.03% | 570,552 | — | 12,477 |
| 2017 | 583,268 | +0.04% | 570,140 | −0.07% | 13,128 |
| 2018 | 581,873 | −0.24% | 567,658 | −0.44% | 14,215 |
| 2019 | 580,480 | −0.24% | 565,520 | −0.38% | 14,960 |
| 2020 | 576,857 | −0.62% | 559,915 | −0.99% | 16,942 |
| 2021 | 569,366 | −1.30% | 550,364 | −1.71% | 19,002 |
| 2022 | 581,427 | +2.12% | 560,522 | +1.85% | 20,905 |
| 2023 | 591,954 | +1.81% | 568,384 | +1.40% | 23,570 |
| 2024 | 593,486 | +0.26% | 566,132 | −0.40% | 27,354 |
| 2025 | 582,477 | −1.85% | 550,328 | −2.79% | 32,149 |
| 2026 | 560,255 | −3.82% | 523,006 | −4.96% | 37,249 |
What is the ‘historical pattern’?
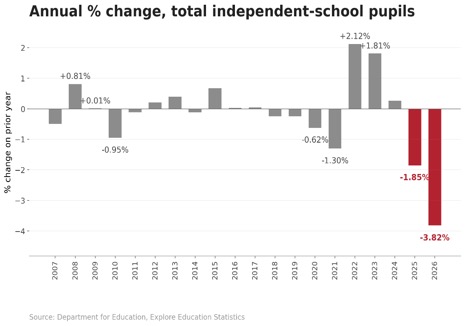
For almost two decades, the Department for Education’s own data show Independent-school pupil numbers remained broadly stable. Annual changes were generally small and, when external shocks caused temporary declines, those declines were followed by recovery.
The financial crisis produced a modest fall before numbers recovered. Covid produced two consecutive years of decline, but by January 2024 pupil numbers had recovered to their highest level in the published twenty-year series.
Are pupil numbers since VAT following the historical pattern as the Government now claims?
The figures for 2025 and 2026 mark a clear break from the historical pattern. Rather than recovering after the first year of decline, pupil numbers fell again—and by a larger amount—producing the largest annual fall and the lowest total number of independent-school pupils in 20 year period.
Unlike previous downturns, this decline follows the introduction of a Government policy whose expected impact was modelled before implementation. Ministers published forecasts and repeatedly argued that the effect on pupil numbers would be limited.
Year-on-year change in independent-school pupil numbers:
Mainstream Independent schools’ figures
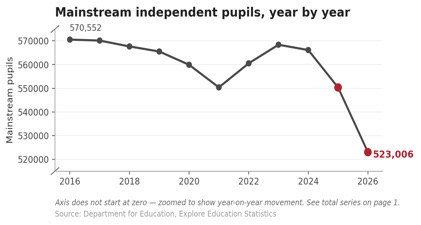
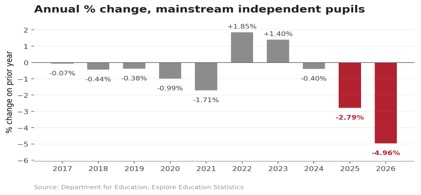
The Department for Education only publishes the mainstream/special split from 2016 onwards. Looking beneath the Government’s headline total, the same conclusion holds—more sharply.
KEY FINDINGS – SINCE VAT
| Lowest total independent-school pupil numbers in the 20-year series.Largest annual fall in pupil numbers.Largest rolling two-year decline.Mainstream schools experienced an even steeper fall because rising independent special-school numbers moderate the headline total.The only comparable decline in the twenty-year series occurred during the Covid pandemic. That does not make today’s decline normal—it underlines how exceptional it is. |
| · Data from the Department for Education directly contradicts the claim that current pupil numbers remain “within historical patterns” |
Conclusion
The Government introduced VAT on school fees with a published business case. Education Not Taxation tested that business case in What Was Promised. What Happened.
It failed.
Ministers have now changed the argument. Instead of defending the forecasts they published, they now claim pupil numbers remain “within historical patterns”.
We tested that claim too.
The Department for Education’s own statistics do not support it.
Government policy should be judged against the promises Ministers made—not against a new test invented after those promises have been broken.
The evidence now points to one conclusion: this policy has failed, and it is time for Ministers to scrap VAT on School fees before further damage is done to children, schools and communities.
 Education Not Taxation