
Education Not Taxation Statement: September 2026
VAT ON SCHOOL FEES: “IN LINE WITH EXPECTATIONS”?
Education Not Taxation responds to the Government’s answer in the House of Lords
On 7 September 2026, Lord Black of Brentwood asked the Government a straightforward question: given that the fall in private-school pupil numbers had already exceeded the level forecast in its November 2024 Tax Information and Impact Note, would the Government review that assessment?
On 21 September 2026, the Government responded.
The answer did not say whether the Government would conduct a review. Instead, it pointed to forecast VAT revenues and argued that the fall in private-school pupil numbers was “in line with expectations”, that pupil numbers had fallen across primary, secondary and independent schools “alike”, and that this was “primarily driven by falling birth rates”.
Those are significant claims. The Government’s own data do not support such a simple explanation.
Education Not Taxation has taken the Government’s answer line by line and tested it against its original forecasts, the OBR’s analysis and the latest DfE pupil data.
GOVERNMENT: “Introducing VAT on private schools will raise £1.7 billion per year by 2029/30.”
ENT: That does not answer the question.
The question was whether the Government should review its original assessment in light of the pupil losses now recorded.
A forecast of future VAT receipts tells us nothing about whether the Government correctly forecast the educational consequences of the policy.
Nor is £1.7bn the same as the net financial benefit to the taxpayer. The Government’s own impact assessment forecast additional state-school costs caused by the policy rising to around £270m a year.
A tax should be judged by everything it does, not simply by the money it collects.
GOVERNMENT: “At Autumn Budget 2025 the re-costing of the measure showed it will raise around £40 million per year more than originally forecast, reaffirming the detailed analysis conducted when this policy was introduced.”
ENT: The £40m re-costing does not reaffirm the Government’s pupil assumptions.
The OBR explains that the increase was driven by its updated forecast for average earnings, used to project fee growth.
GOVERNMENT: “The overall fall in private school pupil numbers since the policy came into effect is in line with expectations…”
ENT: The Government has not shown that.
Its original modelling forecast 37,000 fewer private-school pupils in the long run specifically “as a result of this measure”.
The latest data show 43,126 fewer pupils in mainstream independent schools in England between January 2024 and January 2026 — a fall of 7.62%.
Accepting that these figures are not directly comparable: the 37,000 was the Government’s forecast of the VAT-specific effect; 43,126 is the observed overall fall.
That is precisely why the Government must show how it has concluded that the actual fall is “in line with expectations”.
In the same analysis, the OBR says the largest source of uncertainty remains the change in the number of pupils attending private schools. It did not update its original assumption about pupil losses.
Higher projected fees mean higher projected VAT receipts. They do not prove that the Government correctly forecast how many pupils would leave private education.
GOVERNMENT: “The overall fall in private school pupil numbers since the policy came into effect is in line with expectations…”
ENT: The Government has not shown that.
Its original modelling forecast 37,000 fewer private-school pupils in the long run specifically “as a result of this measure”.
The latest data show 43,126 fewer pupils in mainstream independent schools in England between January 2024 and January 2026 — a fall of 7.62%.
Accepting that these figures are not directly comparable: the 37,000 was the Government’s forecast of the VAT-specific effect; 43,126 is the observed overall fall.
That is precisely why the Government must show how it has concluded that the actual fall is “in line with expectations”.
GOVERNMENT: “The overall fall… reflects demographic change across the whole school system, not the VAT policy alone.”
ENT: Demographics do not explain the scale of the fall.
Between January 2024 and January 2026, pupil numbers across all schools, including independent schools, fell 1.89%. Mainstream independent-school pupil numbers fell 7.62%.
If we give the Government’s argument every benefit of the doubt and apply the entire 1.89% system-wide decline to mainstream independent schools, that would account for around 10,700 fewer pupils.
The actual fall was 43,126.
That leaves more than 32,000 pupils beyond the system-wide decline.
And even that comparison is generous to the Government: the 1.89% figure itself includes the much steeper fall in independent-school pupils.
We do not claim that every one of those additional losses was caused by VAT. But pointing to demographics does not explain a decline so much greater than that seen across the wider school system.
If Ministers have evidence showing that demographics explain that gap, they should publish it.
GOVERNMENT: “We have seen pupil numbers fall across primary, secondary, and independent schools alike.”
ENT: They have not fallen “alike”.
The Government’s own DfE data allow us to compare children of the same age. This matters because children of the same age share the same underlying birth-rate trend.
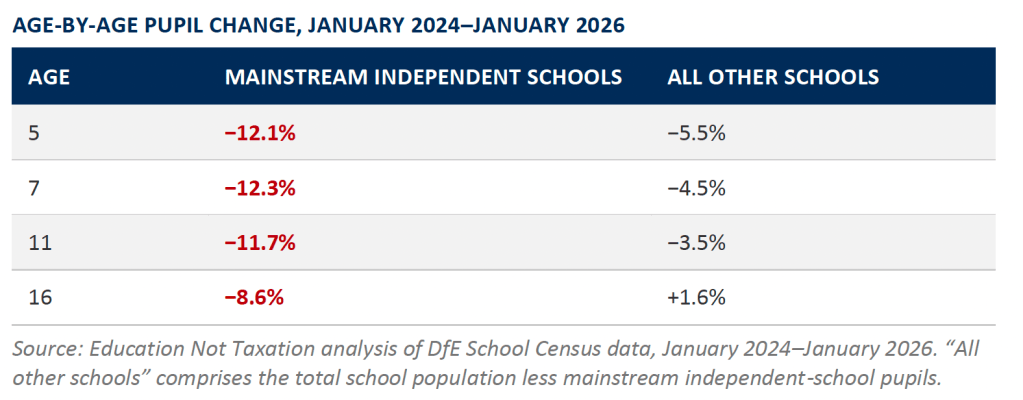
(See the age-by-age comparison below.)
At every age shown, the decline in mainstream independent schools is substantially greater than among children of the same age elsewhere in the school system.
At age 16 the difference is particularly striking: the number of pupils in all other schools increased by 1.6%, while mainstream independent-school pupil numbers fell by 8.6%.
These children share the same underlying birth-rate trend. They are plainly not falling “alike”.
GOVERNMENT: “This is primarily driven by falling birth rates, following a peak in 2012, as cohorts move through secondary school age and smaller year groups enter primary.”
ENT: The Government’s own data do not demonstrate that.
Falling birth rates are real. They were also well known before VAT was introduced and reflected in DfE pupil projections.
With those demographic trends already known, the Government separately forecast 37,000 fewer private-school pupils specifically “as a result of this measure”.
And the age-by-age data allow us to separate the size of the underlying cohort from what is happening specifically in mainstream independent education.
At age 5, mainstream independent pupil numbers fell 12.1%, compared with 5.5% across all other schools. At age 11, the comparison is −11.7% against −3.5%. And at age 16, mainstream independent numbers fell 8.6% while the number of pupils of the same age across all other schools increased by 1.6%.
Falling birth rates cannot, by themselves, explain those differences.
That does not prove that every additional pupil lost from independent education left because of VAT. But it does mean the Government’s assertion that the overall fall is “primarily driven by falling birth rates” needs to be evidenced, not simply stated.
THE QUESTION REMAINS
The Government was asked whether it would review its original assessment in light of the evidence now available.
It didn’t answer.
Instead, it pointed to tax receipts, claimed the pupil fall was “in line with expectations”, and attributed it primarily to demographics. Its own data raise serious questions about both claims.
If the fall is “in line with expectations”, show us.
If it is “primarily driven by falling birth rates”, show us.
And answer the question: will the Government review its original assessment?

